ECG Digitization & AI Analysis

Turn paper, PDF and image ECGs into analysable signals.

Many ECGs still live on paper, in scanned archives or as images sent between sites. Cardiolyse converts them into digital 12-lead waveforms, checks that each image can be digitised reliably and runs them through the same AI analysis as any digital recording.
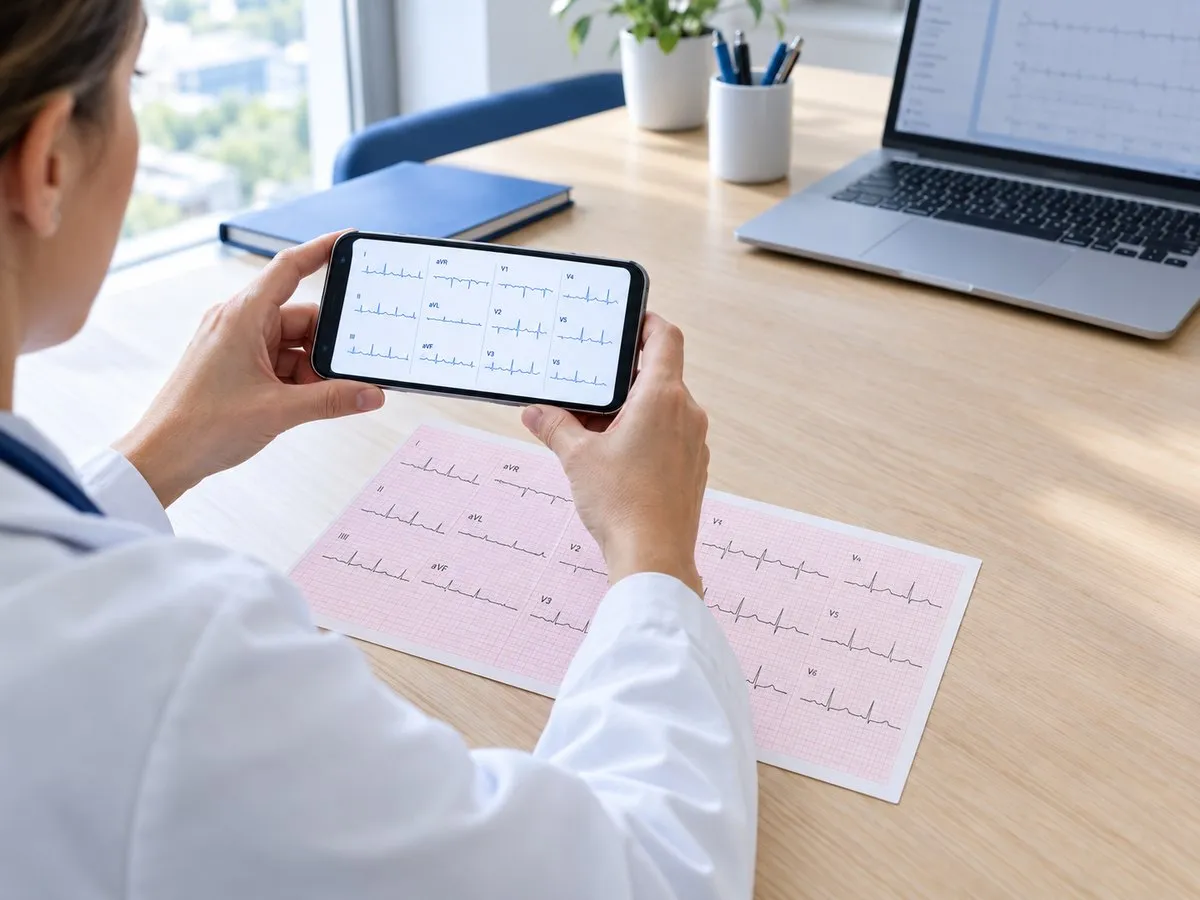
Person in a white coat holding a smartphone displaying ECG waveforms, with a printed ECG chart on the desk and a laptop showing similar data in the background.
Paper ECG digitised · 12 leads reconstructed
3 inputs
Paper scans, PDF files and image files
12
Leads reconstructed as digital waveforms
10 sec
Standard ECG at 25 mm/s
300
ECG parameters available once the signal is digital

A large share of the world’s ECGs still sit on paper.

Paper printouts, scanned PDFs and photos cannot be read by ECG analysis software, which needs the raw digital signal. Paper or physical ECGs remain common, even large, well-resourced hospitals have relied on paper until recently. Digitization puts these ECGs back within reach of AI analysis.

300M
+
ECG tests a year are estimated to be stored only as paper printouts or scanned PDFs in health records, rather than as digital signals.
Natraj et al., ECGLight, arXiv preprint, July 2026
70
+
of the 80,000+ ECGs a year at Barts Health NHS Trust, one of England’s largest, were still performed on paper in 2022–23, before its digital ECG rollout.
Barts Health NHS Trust
Billions
of clinical ECGs exist only as paper scans, making them unusable for modern automated diagnostics.
Stenhede et al., npj Digital Medicine, January 2026

From a picture of an ECG to a signal the AI can read.

ECG printouts come in different layouts and formats. Each step below turns them into a calibrated waveform — and stops the process if an image cannot be digitised reliably.

Image clean-up
Finds the ECG area on the page and removes the background grid, leaving only the traces.
Grid & calibration
Uses the calibration pulse to restore the correct amplitude, for standard 10-second ECGs printed at 25 mm/s.
Lead layout
Supports common printout layouts such as 3×4, 6×2 and 12×1, including rhythm strips, and assigns each trace to the correct lead.
Waveform reconstruction
Extracts each trace from the grid and rebuilds it as a digital signal for each lead.
Readability check
If an image cannot be digitised reliably — for example, missing calibration pulse or heavily overlapping leads — it is flagged and not analysed.
AI analysis
The digital signal goes straight into Cardiolyse resting ECG analytics, with results in the Workspace or via the API.

Same ECG. Now it can be measured.

A printed ECG only shows a picture of the heart’s activity. Once it is digitised, every interval, amplitude and rhythm feature can be measured, compared and stored.

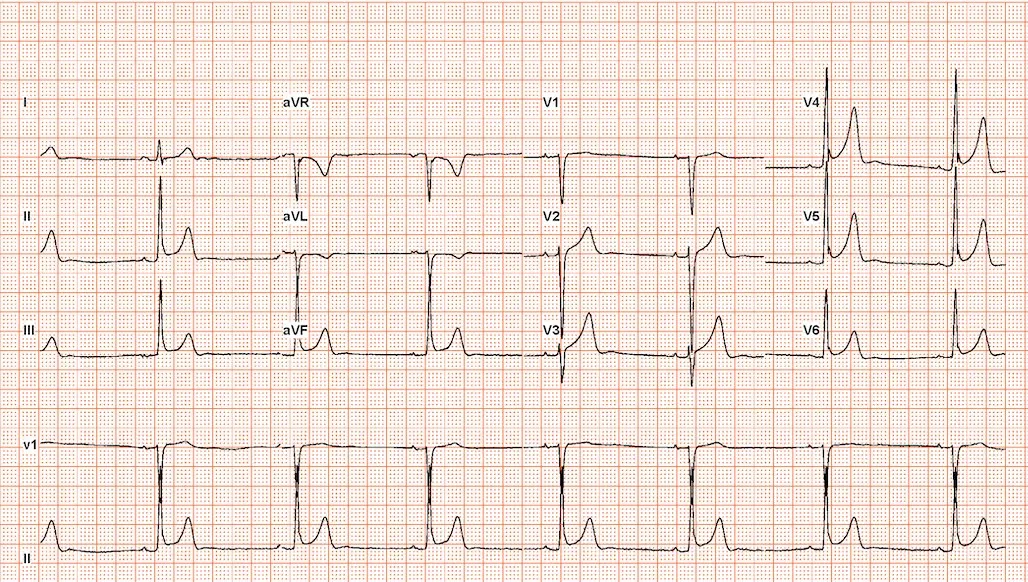
Paper, PDF or image
Electrocardiogram (ECG) tracing showing multiple lead readings including I, II, III, aVR, aVL, aVF, and chest leads V1 to V6, displaying heart electrical activity on standard grid paper.
Remove grid
Calibrate
Reconstruct
Check
Digital 12-lead signal
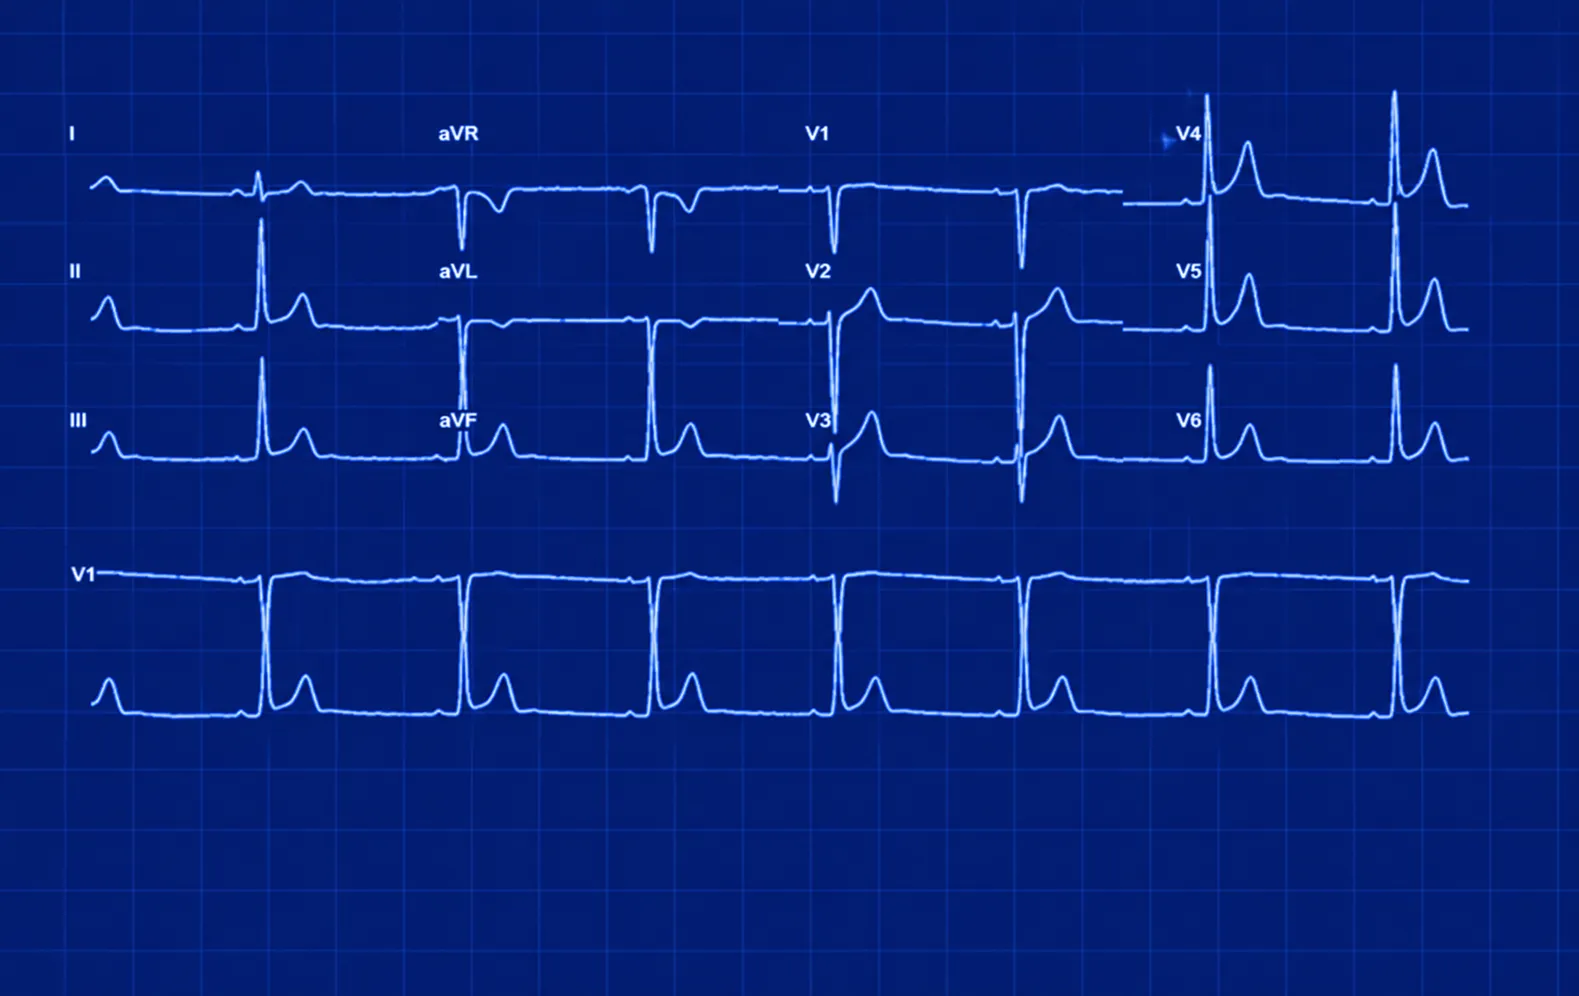
Neon blue ECG tracing on a grid background with labeled leads I, II, III, aVR, aVL, aVF, and chest leads V1 to V6 showing various heart electrical activity waveforms.
Lead I · digitised
Lead II · digitised
Lead III · digitised

From an ECG image to an AI read.

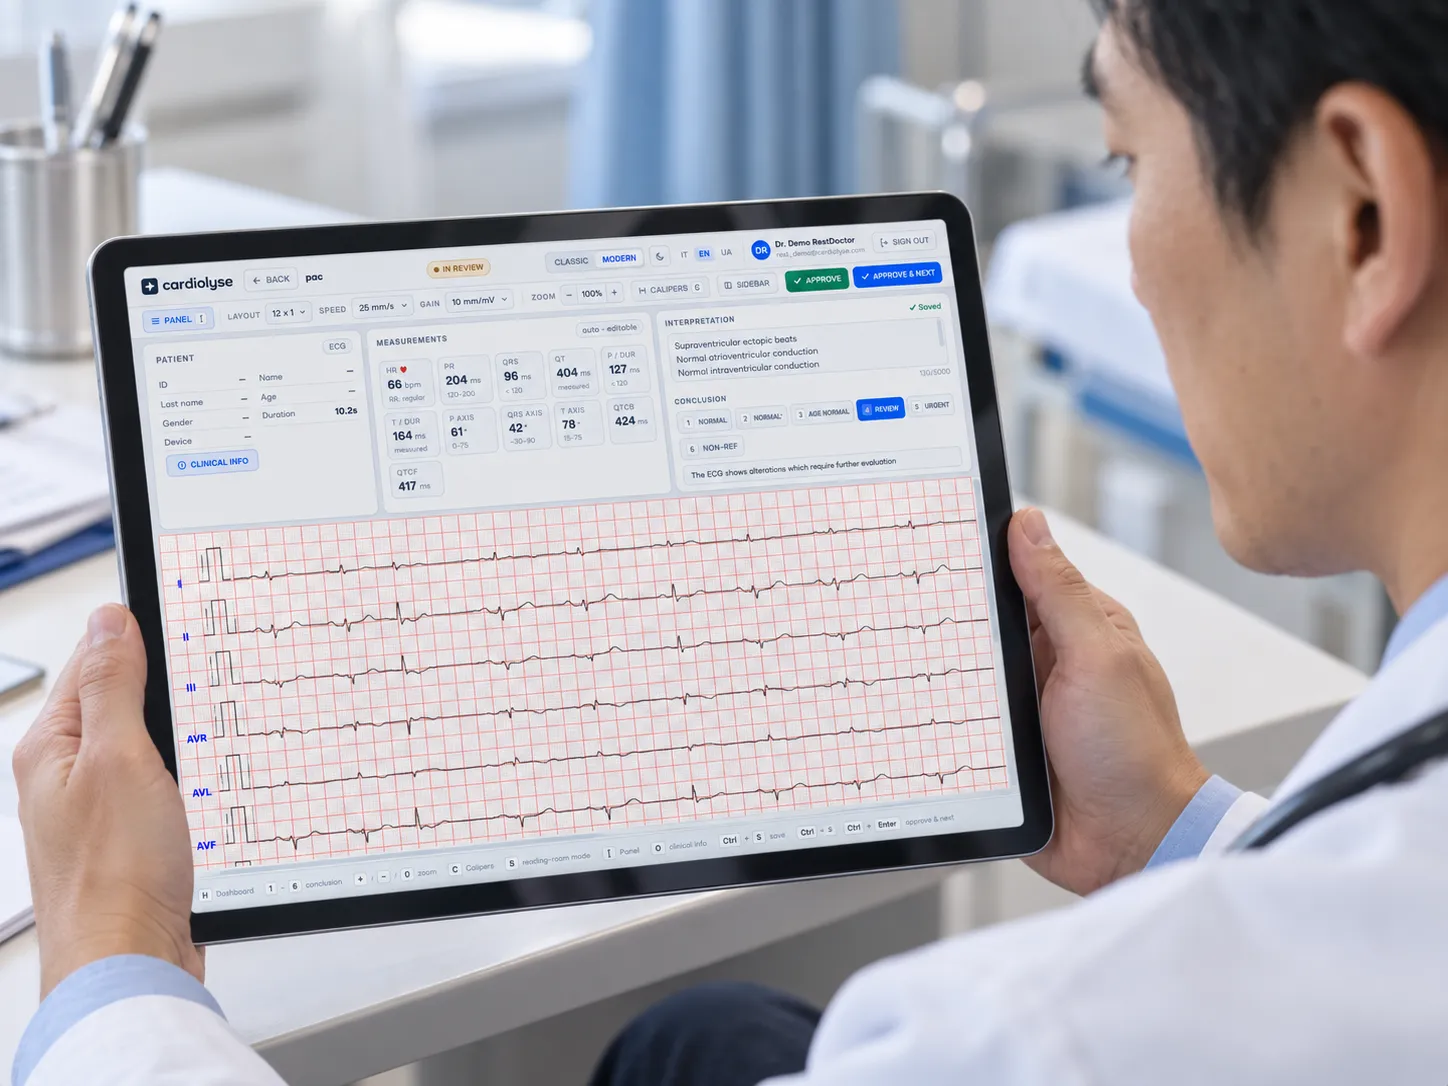
Doctor holding a tablet displaying an ECG report with heart rate and measurements, showing detailed heart activity with red gridlines and interpretation notes on the screen.
04
03
02
01

Capture

Scan a printout or export a PDF or image of the ECG — one at a time or as a batch.

Upload

Send the files through the REST API, a partner integration, or a direct drag & drop upload in our Workspace.

Digitise & check

The grid is removed, the signal is calibrated and converted into a digital waveform, and images that cannot be read reliably are flagged.

Analyse & review

The signal is analysed by Cardiolyse and the result is reviewed in Cardiolyse ECG Workspace or returned to your system.

Built for enterprise ECG volumes.

Designed to plug into platforms, archives and device services, but also offering clinicians the ability to use their mobile phones for upload.

ECG images
Scanned paper printouts
PDF exports from ECG devices
Image files
Common 12-lead printout layouts
Signal + analysis
Digital waveform per lead
Cardiolyse analysis as JSON via REST API
API-first
EU-hosted managed service
OEM and white-label options
Batch processing of recordings

Put ECGs that were stuck on paper to work.

Paper and scanned ECG archives
Turn years of stored printouts into a structured, searchable dataset for research and follow-up.
Sites that share ECGs as images
Analyse ECGs sent as PDFs or image files from clinics without a digital ECG connection.
Telehealth and device partners
Add ECG image upload and analysis to your own product through one API, under your brand.

ECG digitization, answered.

How many ECGs are still on paper?

There is no single global count, but the numbers are large. One 2026 study estimates that around 300 million ECG tests a year are stored only as paper printouts or scanned PDFs, and researchers describe billions of clinical ECGs that exist only as paper scans. Paper ECGs remain especially common in the Global South.

Which files can we send?

Scanned paper ECGs, PDF exports from ECG devices and image files of printed ECGs. Common 12-lead layouts such as 3×4, 6×2 and 12×1 are supported.

What if an image can’t be digitised?

If the software cannot find the calibration pulse or separate the leads, the image is flagged and not analysed, so you can send a cleaner scan.

Is the analysis the same as for a digital ECG?

The digitised signal runs through the same Cardiolyse analysis. Some findings depend on how much of each lead the printout shows — a 3×4 printout, for example, holds only a short segment of most leads — so the report reflects what the image contains.

Can we digitise a whole archive?

Yes. Files can be sent in batches through the API, and results come back as structured data ready for your database or research dataset.

Can we test it on our own ECG images?

Yes. Send us a small anonymised set of images and we will walk you through the results. Contact us to set it up.